Social and brand · Web Scraping
LinkedIn Company Posts and Engagement Dataset
Built by Van Data Team for Social media data client
A scraper that collects each company page into its own CSV: 15,192 posts with 14 fields, from 2016 to 2022, covering post date, media type, text, likes, comments and shares.
- posts from 12 company pages
- 15,192
- likes captured
- 16.8M
Measured outcomes
Outcome 01
15,192 posts from 12 enterprise company pages, 2016 to 2022
Outcome 02
16.8 million likes and 1.1 million comments and shares captured
Outcome 03
Top 1% of posts carry 25% of all likes
Challenge pressure
The client needed every public post from a set of enterprise LinkedIn company pages, each with its date, format and engagement, as data rather than a feed.
The situation
A company page shows its posts as a feed. Comparing how often a brand posts with how much response each post gets needs every post as a row: its date, its format and its likes, comments and shares.
What we built
The scraper covered 14 company pages and wrote one CSV per page, with 14 fields per post. Two pages, Alphabet and Apple, came back empty and Cisco returned only 3 posts, so 12 companies carry data; the gap is stated, not dropped. The brands are public company pages that were scraped, not Van Data Team clients.
What changed
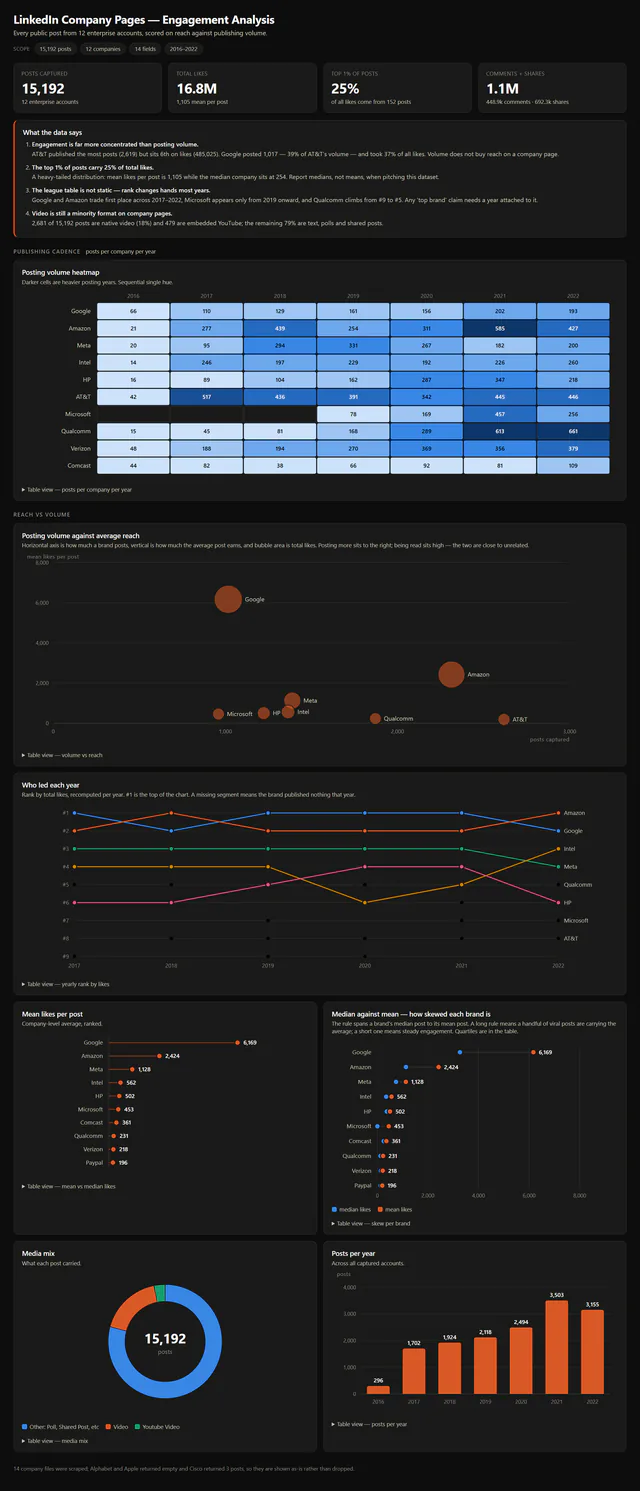
The client got 15,192 posts as rows. The dashboard on this page compares reach with volume: AT&T published the most posts (2,619) but ranks sixth on likes, while Google posted 1,017 times and took 37% of all 16.8 million likes. The league table also changes hands most years, with Google and Amazon trading first place from 2017 to 2022.
Constraints and decisions
Engagement is heavily skewed, so the dashboard reports medians, not means: the mean is 1,105 likes per post while the median company sits at 254, and the top 1% of posts carry 25% of all likes. Video is a minority format, with 2,681 native videos (18%) and 479 embedded YouTube posts. Posts that name individual employees are left out of the rows shown on this site.
Technology stack
Need a similar system?
If this case study maps to your current workflow, the next useful step is a scoped project conversation with constraints, timeline, and integration needs.
Related case studies
More work like this
Academic research
SSRN Research Papers and Authors Dataset
239,037
papers delivered, 43 fields each
Recruiting
Cybersecurity Job Listings from Dice.com
500
Dice.com listings, 23 fields each
E-commerce
B2B IT Hardware Catalogue with Translated Descriptions
72,685
SKUs across 319 brands