
ESG research · Web Scraping
LinkedIn ESG Research Panel
Built by Van Data Team for Quantitative research team
A five-phase scraper for company profiles, posts, engagements and the profiles of the people engaging, followed by an ESG scoring pass with E, S and G dictionaries and N-gram matching, delivered as Stata .dta panel files.
- employee posts scored for E, S and G
- 1.4M
- companies in the Stata panel
- 300+
Measured outcomes
Outcome 01
300+ companies tracked across multi-month windows
Outcome 02
1,395,138 employee posts scored for E, S and G; 108,376 carry a score
Outcome 03
Panel dataset of 146 MB+ delivered as Stata .dta files
Challenge pressure
A quantitative research team needed Stata-ready panel data on more than 300 companies' LinkedIn activity, with employee posts tagged by their environmental, social and governance (ESG) content.
The situation
The team works in Stata and needed a panel: the same 300+ companies observed across multi-month windows. The signal it wanted sits in what employees post and share on LinkedIn, in a form no statistics package reads directly.
What we built
Five phases run in order: company profiles, their posts, the engagements on each post and the profiles of the people who engaged. The pipeline resumes after an error, so multi-day runs go unattended. A scoring pass then matches each post against environmental, social and governance dictionaries with N-gram matching, and the results are shaped into Stata .dta panel files with pandas.
What changed
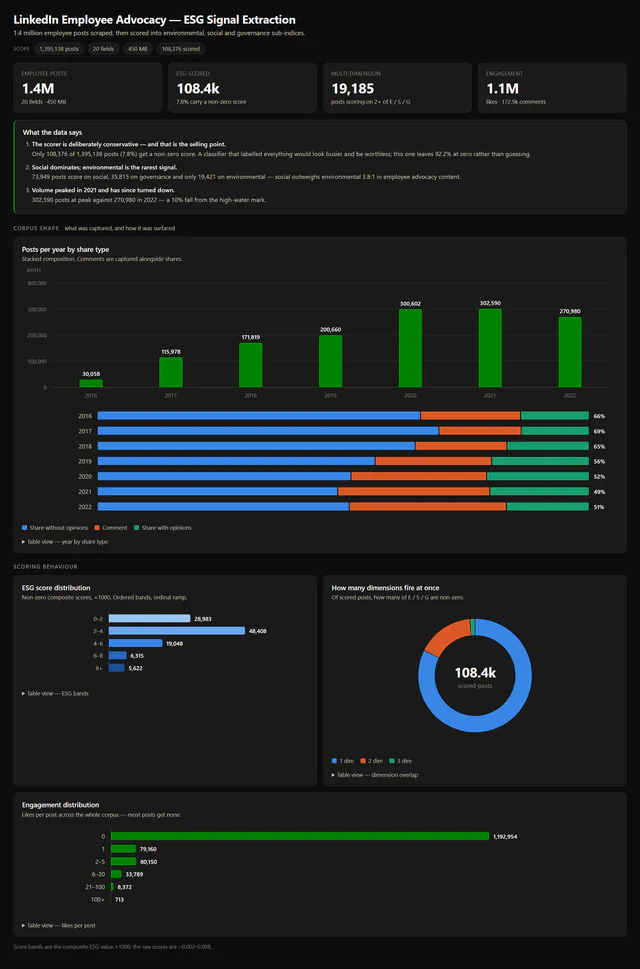
The team received a panel dataset of more than 146 MB as Stata .dta files, covering 300+ companies over multi-month windows. The dashboard on this page, built later from the delivered posts file (1,395,138 rows, 20 fields, 450 MB, aggregated in full), shows the scorer at work: 108,376 posts carry a non-zero ESG score, and 19,185 of them score on two or more of the three dimensions.
Constraints and decisions
The scorer is deliberately conservative: it leaves 92.2% of posts at zero rather than guessing, so only 7.8% carry a score. Social is the most common signal (73,949 posts), governance follows (35,815) and environmental is the rarest (19,421). Posting volume peaked at 302,590 posts in 2021 and fell 10% in 2022. Employee posts name real people, so this page shows aggregates only.
Technology stack
 Python
 SeleniumNLPpandasStata
Need a similar system?
If this case study maps to your current workflow, the next useful step is a scoped project conversation with constraints, timeline, and integration needs.
Related case studies
More work like this
Social intelligence
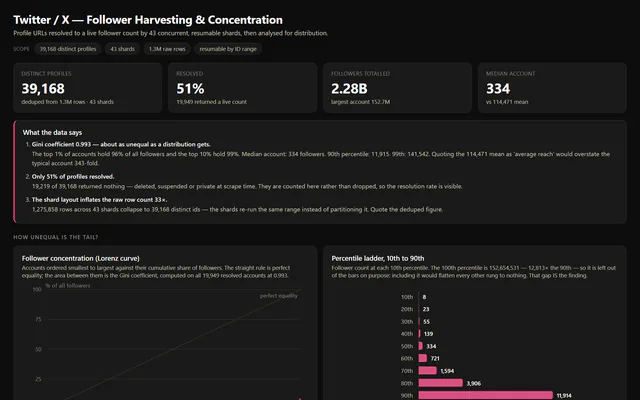
Twitter/X Follower Monitoring at Scale
30,000+
profiles tracked per daily run
Academic research
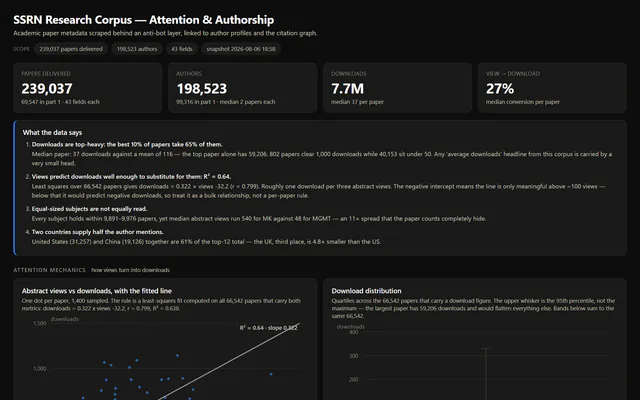
SSRN Research Papers and Authors Dataset
239,037
papers delivered, 43 fields each
Recruiting
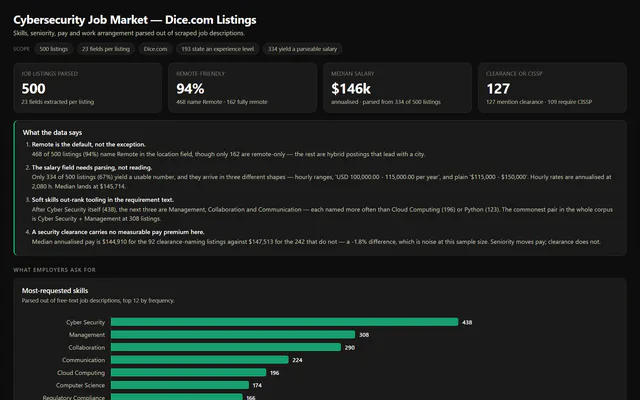
Cybersecurity Job Listings from Dice.com
500
Dice.com listings, 23 fields each