
Social intelligence · Web Scraping
Twitter/X Follower Monitoring at Scale
Built by Van Data Team for Social intelligence client
A sharded Python collector spreads profile links across pre-authenticated accounts in parallel processes, reuses saved sessions, reads each follower count from the profile's JSON-LD and consolidates every run into one snapshot.
- profiles tracked per daily run
- 30,000+
- distinct profiles in the delivered shards
- 39,168
Measured outcomes
Outcome 01
30,000+ profiles tracked per daily run across parallel processes
Outcome 02
43 resumable shards; 39,168 distinct profiles in the delivered files
Outcome 03
Auto-recovery from suspensions, rate limits and CAPTCHA walls
Challenge pressure
Daily follower counts for 30,000 Twitter/X profiles, on a platform that suspends accounts, raises CAPTCHA walls and rate-limits automated reading.
The situation
Follower counts are public, but only one profile at a time, and the platform pushes back on automated reading with suspensions, CAPTCHA walls and rate limits. Tracking 30,000 profiles every day meant the collector had to keep running through all three.
What we built
Python multiprocessing splits the profile links across pre-authenticated accounts. Each account reuses its saved cookies after onboarding, and sessions are validated before use. Workers read the follower count from each profile's JSON-LD, write a per-account audit log for every session and recover from suspensions, rate limits and CAPTCHA walls; the schedule library runs the job daily and the snapshots are consolidated at the end. Runs are split into 43 concurrent, resumable shards.
What changed
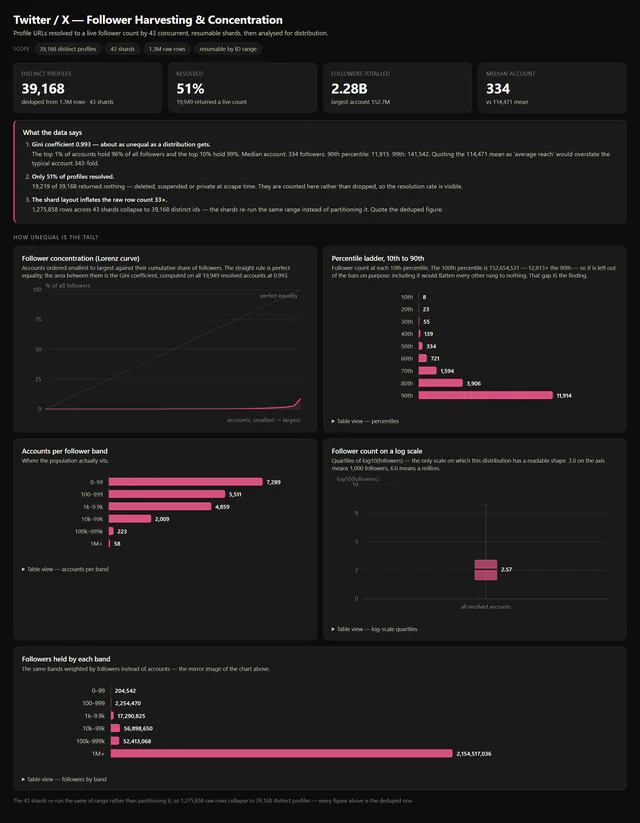
The client gets a daily snapshot of 30,000+ profiles, with an audit log for every account and session. When Van Data Team built the dashboard on this page from the delivered files, the shards held 1,275,858 raw rows that reduce to 39,168 distinct profiles; 19,949 of them (51%) returned a live count, adding up to 2.28 billion followers, with a median account of 334 followers.
Constraints and decisions
Two rules keep the numbers honest. The shards re-ran the same ID range instead of partitioning it, so the deduplicated count is quoted, never the raw rows. The 19,219 profiles that returned nothing (deleted, suspended or private at scrape time) are counted, not dropped. The spread also explains why medians matter here: a Gini coefficient of 0.993, with the top 1% of accounts holding 96% of all followers, so the mean would overstate the typical account 343-fold.
Technology stack
 Pythonmultiprocessing
 SeleniumscheduleJSON-LD
Need a similar system?
If this case study maps to your current workflow, the next useful step is a scoped project conversation with constraints, timeline, and integration needs.
Related case studies
More work like this
ESG research
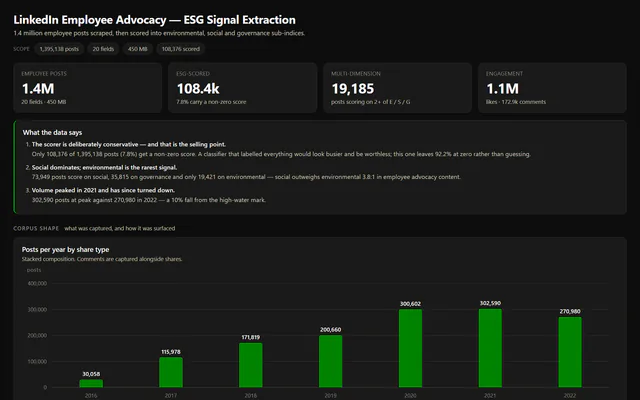
LinkedIn ESG Research Panel
1.4M
employee posts scored for E, S and G
Academic research
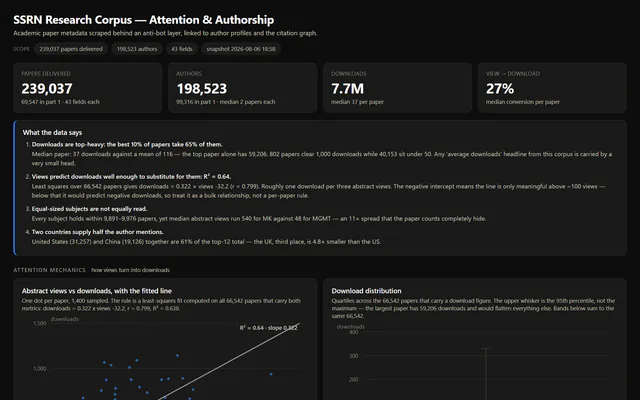
SSRN Research Papers and Authors Dataset
239,037
papers delivered, 43 fields each
Recruiting
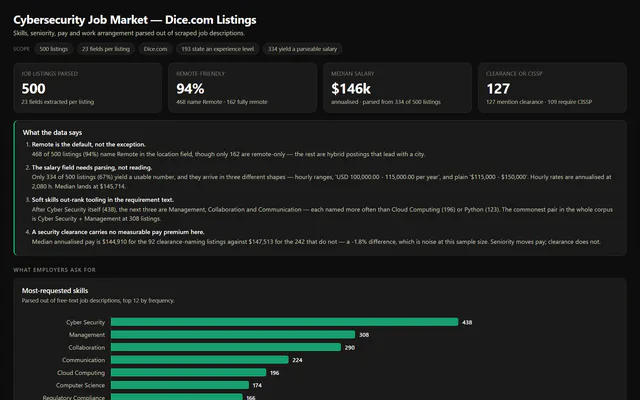
Cybersecurity Job Listings from Dice.com
500
Dice.com listings, 23 fields each