
Energy markets · Data Engineering
Real-Time Electricity Market Pipeline on AWS
Built by Van Data Team for Energy market analytics team
A scheduled AWS Lambda pipeline fetches each NEMWeb dispatch report every five minutes, archives it in S3, writes 19 dispatch metrics per region to DynamoDB and feeds a Plotly Dash app where analysts compare regions.
- ingestion cadence
- 5 min
- dispatch metrics across 5 market regions
- 19
Measured outcomes
Outcome 01
A new AEMO dispatch report ingested every 5 minutes across 5 market regions
Outcome 02
19 dispatch metrics per region, from spot price to net interchange
Outcome 03
Every report archived in S3 and streamed to DynamoDB, with idempotent re-runs
Challenge pressure
AEMO publishes a new electricity dispatch report as a zipped CSV every five minutes. An energy market analytics team needed every report captured, archived and queryable in near real time across all five regions of the National Electricity Market.
The situation
The National Electricity Market covers five regions: New South Wales, Queensland, South Australia, Tasmania and Victoria. AEMO publishes each five-minute dispatch interval on NEMWeb as a zipped CSV, so a team that studies prices, demand and net interchange has to collect a new file every five minutes and keep every one of them.
What we built
An AWS Lambda function, triggered by CloudWatch every five minutes, fetches the latest NEMWeb dispatch zip, unpacks it, keeps the regional dispatch rows (DREGION) and extracts 19 configured fields, among them the spot price (RRP), total demand (TOTALDEMAND) and net interchange (NETINTERCHANGE). The structured CSV is archived to S3, skipped if it already exists, and every record streams to DynamoDB under a composite ID built from SETTLEMENTDATE and REGIONID. A Plotly Dash app gives analysts multi-region selection, a metric picker, file browsing and CSV export.
What changed
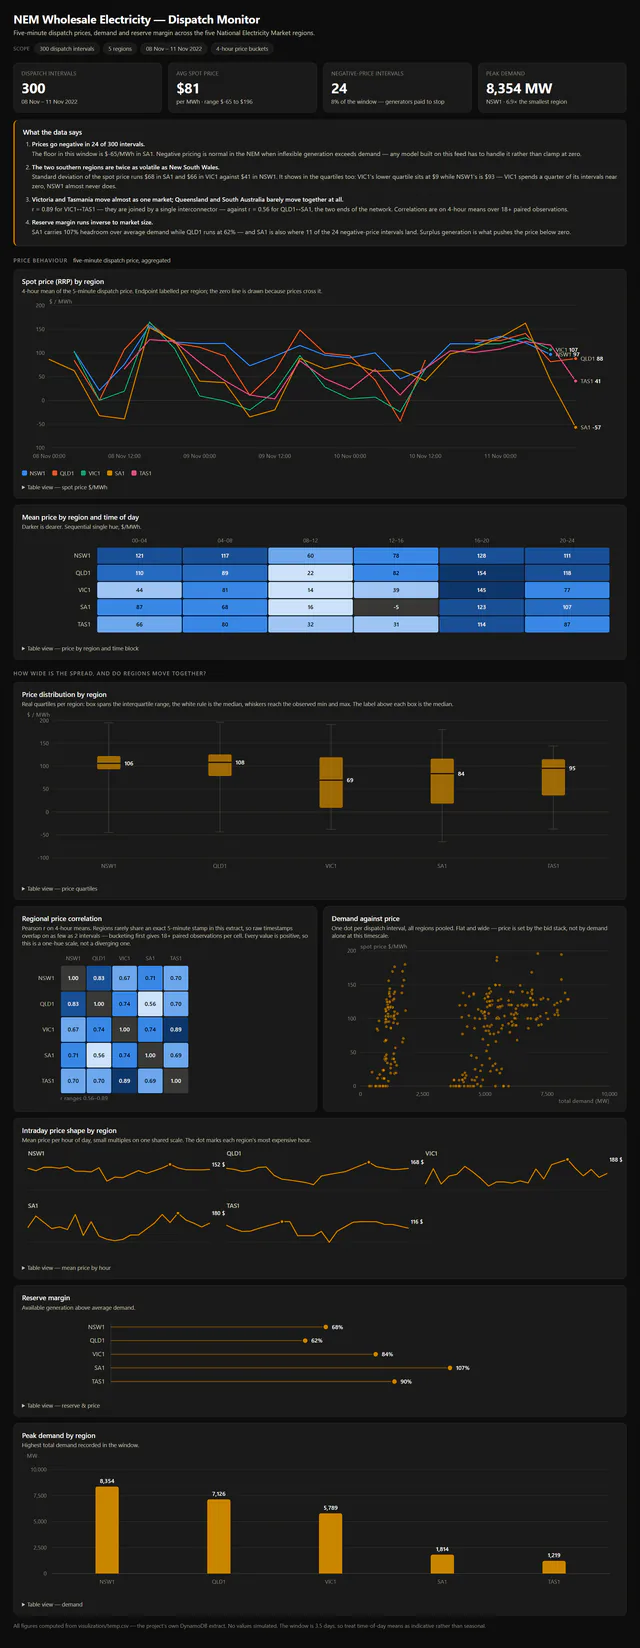
Each five-minute report now lands twice, as a file in S3 and as structured records in DynamoDB, so analysts compare five regions and 19 metrics in one app. The dashboard on this page was built later by Van Data Team from a delivered extract of 300 dispatch intervals (8 to 11 November 2022): an average spot price of $81/MWh, 24 intervals below zero and peak demand of 8,354 MW in New South Wales.
Constraints and decisions
Writes are keyed for the reads: a composite ID of settlement date and region makes per-region time series fast to look up in DynamoDB, and the skip-if-exists check on the S3 archive stops a re-run from processing the same report twice. The data sets one rule for anyone modelling it: prices go negative (down to minus $65/MWh in South Australia in the extract), so a model has to handle negative prices rather than clamp them at zero.
Technology stack
Need a similar system?
If this case study maps to your current workflow, the next useful step is a scoped project conversation with constraints, timeline, and integration needs.
Related case studies
More work like this
Social intelligence
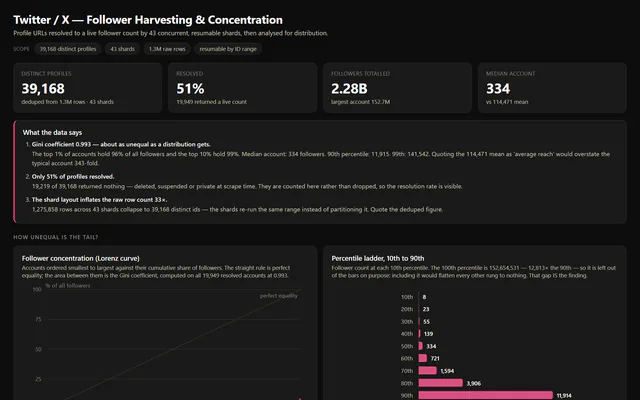
Twitter/X Follower Monitoring at Scale
30,000+
profiles tracked per daily run
ESG research
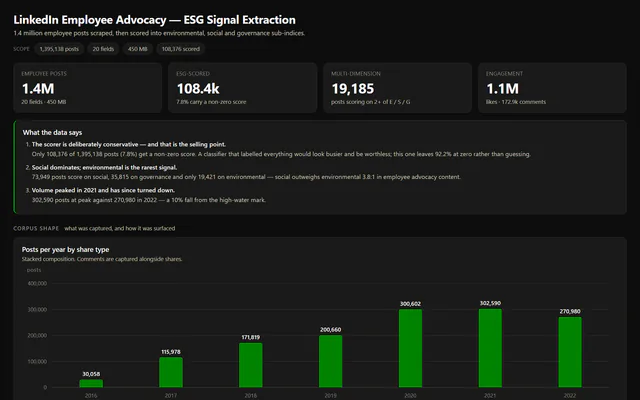
LinkedIn ESG Research Panel
1.4M
employee posts scored for E, S and G
Academic research
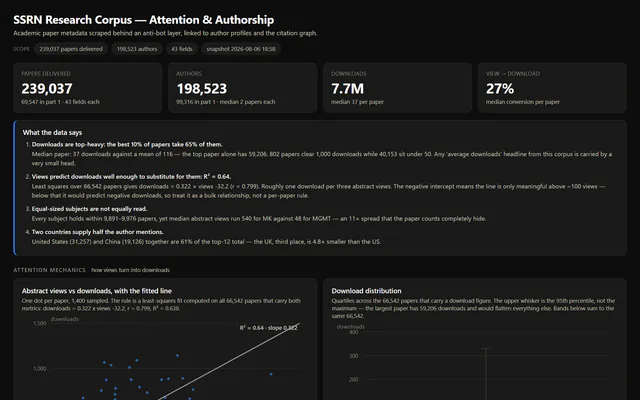
SSRN Research Papers and Authors Dataset
239,037
papers delivered, 43 fields each