Inside A2A's Multi-Cloud FinOps Data Pipeline on AWS
How A2A built a multi-cloud FinOps pipeline on AWS: provider-specific ingestion into one FOCUS model, and when chargeback should stop on bad data.

A2A's multi-cloud FinOps platform shows what trustworthy cloud cost management looks like in production: billing data from AWS, Azure, and Google Cloud lands in Amazon S3, AWS Glue normalizes it to FOCUS, Amazon Athena queries it, and Amazon QuickSight serves role-based dashboards. A2A is the Italian energy and circular-economy company in this case, not an agent-to-agent technology.
For data, platform, and FinOps teams still reconciling cloud bills by hand, the practical lesson is direct: the dashboard is the endpoint, not the architecture. At Van Data Team, we start by mapping billing sources, correction paths, allocation rules, and review gates before selecting a dashboard. That is how production billing pipelines become reliable enough for finance decisions.
The AWS Cloud Financial Management Blog's July 24, 2026 technical deep-dive describes A2A as an Italian energy and circular-economy company with roughly 15,000 employees. Its operations span energy generation, distribution, gas, waste management, and district heating.
AWS and A2A report that the platform eliminated manual spreadsheet consolidation, cut monthly budget review time by approximately 40%, and identified about EUR 1.5 million in annual savings through roughly 100 optimization actions in 2025.
A practical engagement should leave you with a source map, a FOCUS mapping plan, a chargeback release gate, and an operating owner, not another disconnected reporting layer.
Key Takeaways
A2A's case shows that dependable cloud cost reporting starts with normalized billing data and production controls.
- Provider-specific ingestion belongs upstream of a shared FOCUS model.
- Showback can tolerate visible warnings; chargeback should stop when freshness, reconciliation, lineage, or ownership evidence is missing.
- Near-real-time analysis does not prove that streaming is necessary. Source behavior and the required decision window should set the ingestion pattern.
- Build-versus-buy decisions should compare total operating responsibility, not dashboard screenshots.
How A2A's cost architecture works
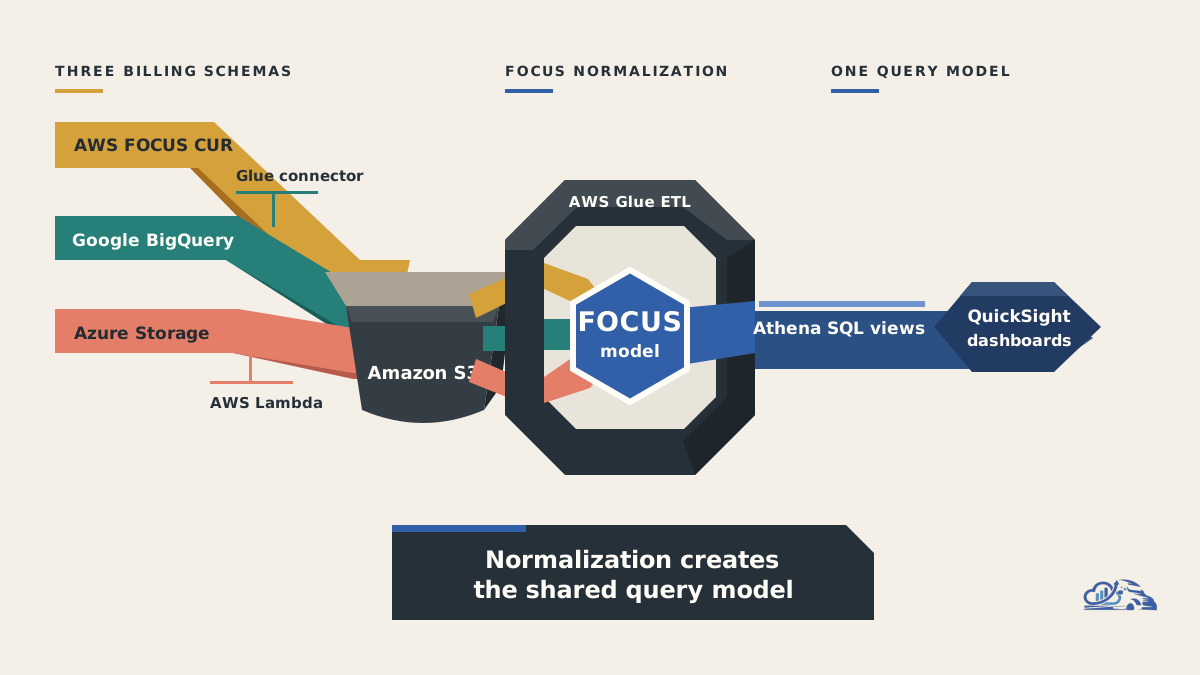
A2A built a cost pipeline on AWS that separates provider ingestion, FOCUS normalization, SQL access, and role-based reporting.
Reported fact. The source architecture can be summarized as follows:
| Layer | A2A implementation reported by AWS | Operating purpose |
|---|---|---|
| Ingest | AWS Cost and Usage Reports, Google Cloud BigQuery exports through AWS Glue connectors, and Azure Storage Account exports through event-driven AWS Lambda functions | Land provider billing data in Amazon S3 |
| Normalize | AWS Glue ETL jobs convert provider billing formats to FOCUS | Create a vendor-neutral analytical model |
| Query | Amazon Athena uses custom SQL views | Expose consistent cost analysis |
| Serve and support | Amazon QuickSight dashboards, Amazon DynamoDB metadata tracking, AWS Secrets Manager, and Amazon SNS and Amazon SES notifications | Control access, track processing context, protect credentials, and notify users |
The AWS source gives the operating ambition a direct title:
"Automating Multi-Cloud Cost Management at Scale: A2A's FinOps Platform Powered by AWS"
The ingestion paths remain provider-specific because the source systems are different. AWS data arrives through FOCUS-compliant AWS Cost and Usage Reports (CUR). Google Cloud billing starts in BigQuery exports and moves through AWS Glue connectors. Azure billing comes from Storage Account exports and is handled through event-driven AWS Lambda functions. All paths converge in Amazon S3.
AWS Glue then performs the important semantic work: transforming different billing formats into the FOCUS standard. Amazon Athena queries the normalized result through custom SQL views, while Amazon QuickSight presents role-based dashboards. The supporting services matter because a production reporting workflow also needs metadata, secrets, and notifications.
Van Data Team analysis. The design is useful because it keeps raw arrival, normalized cost data, analytical views, and presentation as distinct responsibilities. That separation gives operators places to test, replay, reconcile, secure, and recover the workflow.
Why multi-cloud FinOps is a data engineering problem
Multi-cloud cost management succeeds or fails on ingestion, transformation, governance, and serving before anyone opens a dashboard.
Van Data Team analysis. The mistake we see is treating provider exports as if they were interchangeable tables. They are not. Each source has its own delivery behavior, schema, corrections, and commercial semantics. Joining them directly in a BI model pushes unresolved differences into every chart and allocation rule.
A billing-data operating contract should define:
- who owns each source and provider-to-FOCUS mapping;
- how arrival, coverage, and schema changes are detected;
- whether a load can be replayed without duplicates;
- how source totals reconcile to normalized totals;
- how restatements propagate to views and dashboards;
- which dataset state is approved for showback or chargeback;
- how a dashboard value traces back to its source export.
Consider a composite operating scenario. Finance has reviewed a billing period, then a provider restates part of the export. A production pipeline detects that the period changed, reprocesses only the affected data, reruns reconciliation, refreshes downstream views, and marks the prior allocation as superseded. A spreadsheet process can silently preserve the old total.
This is why a FinOps platform needs the same ownership, observability, and failure recovery as any financially consequential data product. The practical target is not merely fresh data. It is fresh, explainable, reproducible data.
A production gate for FOCUS normalization and chargeback
FOCUS creates a shared query model, but implementation teams still need explicit mapping, reconciliation, and release controls.
Reported fact. A2A used AWS Glue ETL to transform AWS, Azure, and Google Cloud billing formats into FOCUS, then queried the normalized data with Amazon Athena.
Van Data Team analysis. Treat each provider-to-FOCUS transformation as a version-controlled contract. Preserve the source record and ingestion context, surface unmapped values, review schema changes, and compare source totals with normalized totals. Do not assume every provider concept maps cleanly without a documented decision.
The following readiness gate is an implementation artifact, not a claim about additional A2A components:
| Gate | Required evidence | Block chargeback when |
|---|---|---|
| Source arrival | Expected period coverage and recorded ingestion status | Arrival or coverage is missing or unknown |
| Schema contract | Current mapping is versioned and unmapped values are visible | Drift is silent or changes are unreviewed |
| Load control | Reprocessing is idempotent and duplicate-safe | Replay behavior is unknown |
| Reconciliation | Source and normalized totals are compared, with differences explained | A material difference lacks approval |
| Freshness | Dataset state is measured against a finance-approved SLA | Freshness is stale or cannot be established |
| Restatements | Corrections are traced and propagated downstream | Updated source data has not reached approved views |
| Lineage | A dashboard charge traces to a view, normalized record, and source export | The source path cannot be reconstructed |
| Allocation readiness | Ownership rules, exceptions, and unallocated spend are explicit | Spend would be assigned without an approved rule |
| Access governance | Spend data is exposed through approved roles | Access exceeds business need |
| Pipeline economics | Storage, ETL, query, and dashboard consumption are reviewable | Operating cost cannot be established |
Exact tolerances and freshness windows belong to finance, FinOps, and the platform owner. The pipeline should enforce their policy, not invent it.
Showback and chargeback also deserve different release behavior. An informational dashboard can remain available with a visible stale-data or reconciliation warning. Financial allocation should stop when the evidence is incomplete. That review gate prevents automation from turning a data defect into an accounting dispute.
A useful scoped review produces the source inventory, mapping ownership, reconciliation design, backfill path, SLA policy, access model, and incident runbook. It also connects the data controls to the wider cloud cost optimization workflow.
Operating trade-offs beyond the dashboard
An Amazon S3, AWS Glue, Amazon Athena, and Amazon QuickSight stack is flexible, but the team still owns data changes, query behavior, access, recovery, and pipeline cost.
Van Data Team analysis. Operate this lakehouse-style stack as a financially consequential data product, with explicit owners and recovery paths.
Incremental loads and billing corrections
Do not equate "new file" with "new immutable fact." Billing data can arrive late or be restated. Track which periods and source objects changed, make transforms replayable, and rebuild affected normalized data and views consistently. Keep raw inputs long enough to explain a correction.
A second composite scenario starts with schema drift. A provider export introduces values the current mapping does not recognize. The correct response is to quarantine or flag the exception, keep investigation views available, and block affected chargeback until the mapping is reviewed. Silently coercing the value protects dashboard uptime at the expense of trust.
Observability, cost, and access
Monitor arrival state, transform status, row-level anomalies, reconciliation results, view freshness, and dashboard readiness. Alerts need an owner and a recovery action. A notification without a runbook only moves the uncertainty to someone's inbox.
The cost-management pipeline is itself a cloud workload. Track storage growth, transformation runs, query consumption, dashboard usage, and operator time. Apply cloud cost guardrails to the FinOps platform itself so the cost of measuring cost remains visible.
Spend data can expose account structure, project ownership, vendor use, and business priorities. Enforce role-based access across raw data, normalized tables, views, and dashboards. Keep credentials in AWS Secrets Manager rather than transformation code, and preserve auditability across every serving layer.
Adjacent tools are options, not the A2A stack
Airflow can fit where teams already operate it for orchestration. dbt can fit SQL-centric transformations and tests. Delta Lake or another table layer can help when stronger table-management behavior is needed. Catalog, lineage, and data-quality tools can extend an existing governance model.
Kafka only fits when source events and the decision window justify streaming. Near-real-time reporting alone is not proof. Teams should start by choosing batch versus streaming from source cadence, latency needs, replay behavior, and operational burden. AWS did not report that A2A used these adjacent tools.
Build or buy: choose the operating model, not the demo
A custom FOCUS pipeline makes sense when control and tailored integration outweigh maintenance; a third-party platform fits when packaged workflows and managed operations outweigh deep customization.
Van Data Team analysis. The comparison should cover the full operating model:
| Decision area | Custom FOCUS pipeline | Third-party FinOps platform |
|---|---|---|
| Data control | Raw billing, mappings, lineage, and models stay in the existing platform | Vendor-managed ingestion may reduce internal work if policy allows it |
| Allocation logic | Strong fit for organization-specific ownership and finance rules | Strong fit when packaged allocation covers the workflow |
| Engineering ownership | Team owns connectors, tests, backfills, incidents, and provider changes | Vendor carries part of the operating burden |
| Delivery path | Faster when reusable platform components already exist | Faster when standard connectors and reports are acceptable |
| Extensibility | Supports custom joins, controls, and internal integrations | Depends on supported APIs, exports, and workflows |
| Economics | Compare infrastructure and continuing engineering effort | Compare licensing, integration, administration, and exit costs |
| Exit strategy | Code and models remain under internal control | Verify export completeness and migration paths before commitment |
Choose custom engineering when allocation rules are distinctive, billing data must join internal finance or platform models, and engineers can own the pipeline on call. Choose a third-party platform when standard workflows cover the need, managed connectors reduce risk, and delivery speed matters more than customization.
Test either route against the same representative inputs: a normal billing period, a late arrival, a restatement, a mapping exception, and a restricted-access request. Evaluate completeness, reconciliation, lineage, recovery effort, review burden, and total operating cost. Neither option is universally cheaper.
For teams running heavy AWS data workloads, AWS cost optimization for data stacks provides useful adjacent context. The same workload-first discipline should shape a multi-provider FinOps decision.
What the A2A result establishes
A2A's reported outcome shows that a normalized, automated cost-data workflow can support faster review and concrete optimization work in one enterprise context.
Reported fact. AWS and A2A connect the platform with the removal of spreadsheet consolidation, a shorter monthly review process, and identified annual savings.
Van Data Team analysis. Those results are case-study outcomes, not universal benchmarks. The source does not establish that FOCUS normalization alone created the savings, nor does it provide a general ROI formula. Optimization value also depends on ownership, action tracking, workload decisions, and whether teams close the loop after an opportunity appears.
The defensible lesson is narrower and more useful: trustworthy normalized data reduces the friction between a cost signal, an accountable owner, and an operational decision.
Operational Budget
Reported fact. AWS describes A2A's multi-cloud FinOps implementation as an Amazon S3, AWS Glue, Amazon Athena, and Amazon QuickSight billing-data pipeline; it does not report an AI agent in that architecture.
Van Data Team analysis. If you add an agent for mapping exceptions, investigating anomalies, or drafting optimization actions, budget it as a governed workflow component. Keep FOCUS validation, reconciliation, and chargeback controls deterministic.
Before production, run every candidate through the same versioned evaluation harness using representative billing scenarios, known-good outputs, schema checks, SQL reconciliation tests, and a human approval rubric. Record:
- accepted-output cost, including model usage, orchestration, retries, reviewer time, and recovery work;
- end-to-end latency, token budget, retry rate, and reviewer minutes per approved result;
- failure-recovery behavior after timeouts, malformed output, stale inputs, or partial tool failure;
- evaluation results by task type, with failed cases retained for regression testing.
Vendor token pricing is only the starting point. The operational metric that matters is cost per approved workflow result: total run, review, retry, and recovery cost divided by outputs that pass the evaluation gate. Compare that figure with a deterministic implementation and manual handling before deciding whether the agent belongs in the billing path.
Conclusion: make cost data trustworthy before automating
A2A's AWS architecture is a clear example of multi-cloud FinOps built as a data platform. Provider-specific billing enters Amazon S3, AWS Glue converts it into FOCUS, Amazon Athena exposes queryable views, and Amazon QuickSight serves role-based reporting. The reported business outcomes sit downstream of that engineering work.
For another organization, the right next step is not to copy the service list. Map the actual billing sources, allocation rules, correction paths, consumers, and approval boundaries. Then define the source-to-dashboard lineage, reconciliation policy, freshness SLA, restatement workflow, access controls, operating cost, and incident owner.
Van Data Team can turn that assessment into a concrete delivery package: a billing-source map, FOCUS normalization scope, chargeback readiness gate, dashboard gap review, build-versus-buy decision record, and phased implementation plan. Start with the workflow that finance and engineering must trust, then choose the stack that can keep that promise.

Founder of Van Data Team. Builds Vanaxity, the AI agent system for SEO, GEO, and AEO, and leads data engineering delivery for B2B teams.
About the authorArticle FAQ
Questions readers usually ask next.
These short answers clarify the practical follow-up questions that often come after the main article.
Need a similar system?
If this article maps to a workflow your team already operates, the next step is usually a scoped review of the system, constraints, and rollout path.
Consultation
Scope your next AI workflow.
Share the system and blockers. We will map fit, gaps, and the next step.