Amazon Bedrock AgentCore Observability: Per-Agent Logs and Traces
How Bedrock AgentCore splits runtime logs from trace spans, why CloudWatch Transaction Search must be on, and what per-agent log groups do not give you.
Claims that Amazon Web Services updated Amazon Bedrock AgentCore observability so newly created agents in supported AWS Regions default to dedicated, per-agent CloudWatch log groups are not established by a cited authoritative source in this draft. The AWS AgentCore release notes should be checked for an explicit release-level confirmation before teams treat that behavior as an announced default.
Transaction Search is not automatic. The AWS AgentCore observability guide says first-time users must enable it once and that spans can take about ten minutes to become searchable.
This distinction matters when an agent does more than return a response. An autonomous workflow may plan, select tools, retry an action, call another service, or stop for human review. Model quality is only part of the operating problem. Teams also need enough evidence to reconstruct what happened when the workflow stalls or produces the wrong outcome.
At Van Data Team, we start by mapping those workflow states, tool permissions, review gates, and recovery paths. For teams building production AI agent workflows, this article turns the proposed observability model into practical outputs: an observability architecture, deployment verification artifact, investigation patterns, SLO framework, and production checklist.
Key Takeaways
Amazon Bedrock AgentCore can support a cleaner telemetry boundary when dedicated groups are verified or configured, but production teams still need to configure and govern how that telemetry is used.
- Do not assume new AgentCore agents in supported AWS Regions receive dedicated per-agent CloudWatch log groups by default; verify their actual configuration and authoritative release documentation.
- AWS documents separate destinations for agent runtime logs and trace spans.
- CloudWatch Transaction Search must be enabled before AgentCore spans and traces become searchable.
- Per-agent isolation narrows debugging and ownership boundaries, but fleet-wide queries and policies still require deliberate design.
- Trace-based SLOs, failure alerts, retention, sampling, and escalation rules remain the operator's responsibility.
What Changed in Amazon Bedrock AgentCore Observability
If verified, the claimed default would give newly created AgentCore agents an isolated CloudWatch log boundary, while operators could use Transaction Search and CloudWatch's GenAI observability surfaces to investigate traces.
The same AWS setup documentation states the indexing caveat plainly:
"After you enable Transaction Search, it can take ten minutes for spans to become available for search and analysis."
The core specifications are:
| Item | Described or documented behavior | Operational consequence |
|---|---|---|
| Claimed update scope | A default dedicated per-agent log group for newly created agents in supported AWS Regions is not established by the citations here | Verify each agent's actual log group and authoritative release documentation |
| Runtime logs | /aws/bedrock-agentcore/runtimes/<agent_id>-<endpoint_name>/[runtime-logs] <UUID> | Investigations can begin with a specific agent and endpoint |
| Trace spans | /aws/spans/default | Trace discovery remains centralized through Transaction Search |
| Investigation surfaces | CloudWatch GenAI observability page and CloudWatch Logs | Operators can move between curated views, sessions, traces, and runtime evidence |
| Required activation | Transaction Search must be enabled before spans are searchable | Trace verification belongs in deployment readiness, not post-incident setup |
According to CloudWatch's AgentCore documentation, CloudWatch provides curated observability views and prompt tracing for managed agents. These views help operators monitor agent health and inspect behavior, but they do not define a workflow-specific SLO or incident policy for the team.
That separation is important. AWS documents where telemetry lands and how it becomes searchable. The recommendations below are Van Data Team's operating analysis, not additional AWS product claims.
Why Per-Agent Isolation Changes Production Operations
When present, dedicated log groups narrow the starting point for debugging, ownership, and cost mapping, but teams still need a fleet-level operating model.
| Operating concern | Shared log stream | Dedicated per-agent groups | Remaining work |
|---|---|---|---|
| Debugging | Unrelated events must be filtered repeatedly | Investigation starts inside the affected agent and endpoint boundary | Correlate failures that cross agents or services |
| Incident response | Ownership and blast radius can take longer to establish | Responders can open the affected agent's group directly | Maintain an agent inventory and escalation owner |
| Cost mapping | Allocation depends heavily on parsing mixed events | A log group can become an input to an allocation model | Isolation does not create automatic billing attribution |
| Access control | Policies may cover a broad shared stream | Controls can be aligned more closely with agent boundaries | More groups create more policy work |
| Fleet analysis | Global searches begin in a common stream | Routine agent investigations contain less noise | Cross-group dashboards and queries must be designed |
The mistake we see is treating isolation as the finished observability model. It is a useful boundary, not a complete control plane.
Consider a hypothetical reporting agent that retrieves warehouse data, applies business rules, and produces an executive update. With a shared stream, an operator investigating a bad result may have to separate that run from unrelated agents and endpoints. A dedicated group makes the initial search cleaner. The related trace can then show whether the problem began during retrieval, tool selection, transformation, or delivery.
That pattern is especially useful for observable agentic reporting workflows, where a plausible final answer can still hide a failed source query or incomplete handoff.
Cost attribution also becomes easier to model, but not automatic. Teams can map each group to an agent owner, environment, endpoint, workflow, and internal cost center. If token budgets matter, record the budget decision and related identifiers in application telemetry. The log-group name alone is not a token accounting system or billing report.
For incident response, maintain a fleet inventory that connects each agent and endpoint to its log group, workflow owner, downstream tools, escalation path, and runbook. Van Data Team's production agent escalation playbook provides a broader pattern for deciding when an automated run should retry, fall back, stop, or reach a human operator.
How Distributed Traces Expose Agent Failure Modes
Distributed traces reconstruct the observable execution path so operators can locate where an agent stalled, looped, selected the wrong tool, or accumulated unexpected latency.
A useful trace follows the workflow from prompt or session context through decision points, tool calls, results, and the next observable transition. It should be treated as execution evidence, not as a guaranteed transcript of every hidden model thought.
| Symptom | Trace investigation | Recommended response |
|---|---|---|
| Workflow stops early | Find the last completed span and the expected transition that did not occur | Inspect tool availability, permissions, routing, timeout handling, and fallback behavior |
| Agent repeats an action | Look for repeated stages or repeated tool attempts | Stop the run, inspect retry logic, and add a workflow repetition guardrail |
| Agent chooses the wrong tool | Compare the selected tool with the workflow contract and allowed action | Tighten tool descriptions, permissions, routing rules, or review requirements |
| Session runs slowly | Compare elapsed time across important workflow transitions | Establish a baseline and alert on deviations that matter to the user-facing objective |
| Telemetry volume spikes | Isolate the agent's logs and inspect its trace pattern | Review retries, loops, span sampling, and retention before changing the wider fleet |
Imagine a hypothetical procurement agent that can retrieve supplier records, prepare an approval request, and send an approved action to another system. If the wrong tool is selected, the final error may not explain why. The session trace gives the operator a path back through the selected action, preceding decision boundary, and tool result.
The response should match the risk. A harmless read failure may justify a retry. An attempted write with ambiguous authorization should stop and enter a review queue. Teams designing that boundary can use human review for risky agent actions to connect observability evidence with approval and escalation design.
Trace investigations should also feed evaluation. When an incident reveals a routing error, loop, missing fallback, or unsafe tool choice, convert the scenario into a regression case. Observability explains the failure; evaluation determines whether the proposed change prevents it from recurring.
Build a Production AgentCore Observability Checklist
A production-ready setup pairs AWS's telemetry destinations with team-defined reliability objectives, alerts, governance rules, and recovery paths.
Start with a clear implementation architecture
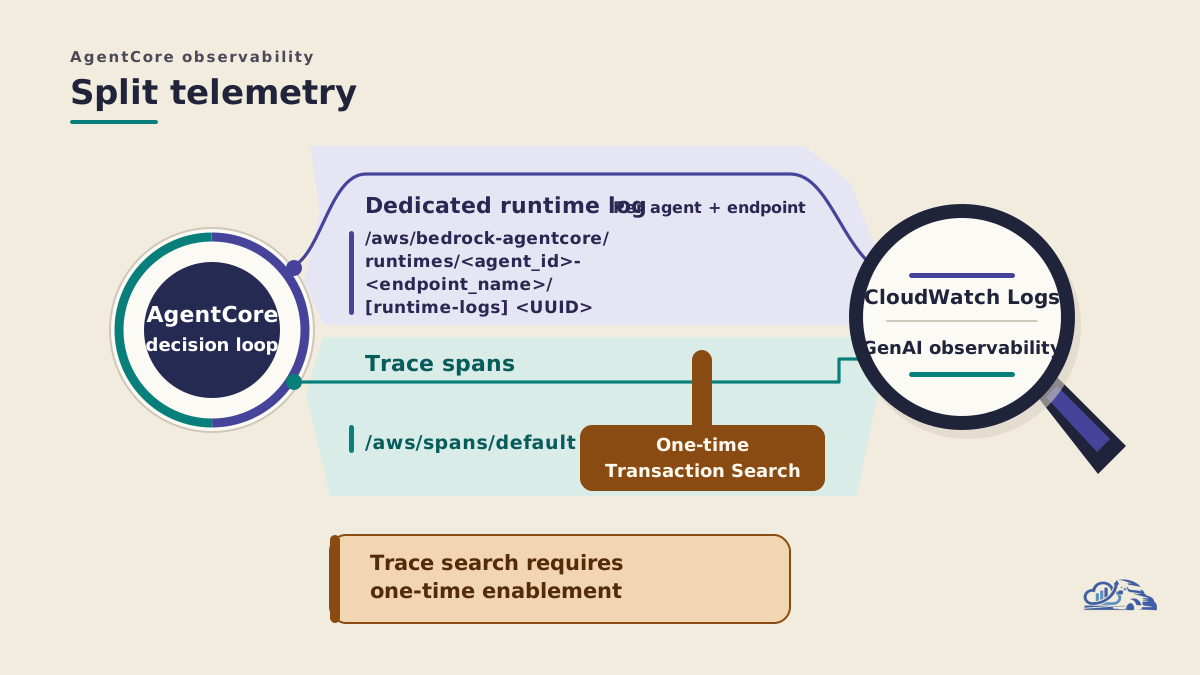
The operating flow should be simple enough to explain during an incident:
For an AgentCore runtime verified to use the documented agent-specific log-group pattern, runtime and endpoint events flow into that group. Trace spans flow to /aws/spans/default. Transaction Search makes those spans searchable after activation and indexing. Operators use CloudWatch Logs and the GenAI observability page to move from the affected agent to its session and trace.
Application-level identifiers should connect that technical evidence to the business workflow. Useful correlation data may include the workflow name, environment, deployment version, owner, session identifier, trace identifier, tool class, review state, and final outcome. Confirm which fields your implementation actually emits before building alerts or dashboards around them.
Record deployment verification as an artifact
Use the following template during deployment. It is an operational checklist, not an AWS configuration file:
Agent:
Endpoint:
Expected runtime log group:
Transaction Search enabled:
Spans searchable:
GenAI observability view checked:
Prompt or session trace checked:
Workflow owner:
Incident runbook:
Retention and sampling policy:
Verification should cover logs and traces separately. A visible runtime log does not prove that spans are searchable. Likewise, a trace without a clear owner or runbook does not make the workflow incident-ready.
Define trace-based reliability objectives
Avoid inventing AgentCore metric names or copying arbitrary thresholds from another workload. Define objectives from the workflow's baseline, risk, and customer commitment.
| Reliability concept | What the team should decide |
|---|---|
| Workflow completion | What counts as a correct, usable business outcome |
| End-to-end latency | How long the complete session may take before it harms the workflow |
| Tool-call outcome | Which failures qualify for retry, fallback, or immediate escalation |
| Unexpected repetition | What pattern indicates a loop rather than a valid retry |
| Trace completeness | Which workflow transitions must be visible for diagnosis |
| Human escalation | Which conditions must stop automation and request review |
| Recovery | How the workflow resumes or compensates after a failed action |
Alert on operational symptoms that require action, such as meaningful tool failures, stalled workflows, repeated actions, unexpected latency, missing evidence, or failed fallbacks. Preserve trace identifiers in incident records so responders can move directly from the alert to the relevant session.
Govern retention, sampling, and sensitive data
Retention should reflect investigation needs, regulatory obligations, privacy risk, and cost. Verify current CloudWatch settings and pricing before committing to a policy.
Sampling successful routine traffic can reduce telemetry volume, but do it only after confirming that failures remain diagnosable. Preserve enough anomalous, failed, and high-risk runs to reconstruct incidents and evaluate fixes.
Prompts, tool inputs, tool outputs, and session metadata may contain sensitive information. Review what enters logs and spans, restrict access, and redact data that operators do not need. More telemetry is not automatically better telemetry.
If you want to operationalize this observability model, Van Data Team can deliver a scoped workflow review, agent-to-signal map, dashboard gap assessment, trace-based SLO proposal, retention plan, and incident runbook through our AI agent development work.
Common mistakes to avoid
The main mistakes are treating telemetry as automatic, confusing isolation with attribution, and collecting evidence without a response plan.
- Assuming Transaction Search is already enabled.
- Declaring setup broken before the documented indexing period has passed.
- Assuming any existing or newly created agent uses a per-agent log group without verifying its actual configuration.
- Modifying the AWS-documented log path in documentation or runbooks.
- Treating a dedicated group as an automatic cost report.
- Inventing metric names or default alert thresholds.
- Inspecting runtime logs without following the related session trace.
- Designing agent isolation without fleet-wide inventory and search.
- Retaining every span without a cost, privacy, or investigation rationale.
- Presenting team-defined SLOs as AWS defaults.
Tooling And Landscape Fit
AWS documents that newly created AgentCore agents in supported Regions default to dedicated CloudWatch log groups, using /aws/bedrock-agentcore/runtimes/<agent_id>-<endpoint_name>/[runtime-logs] <UUID>, while spans are stored under /aws/spans/default. Amazon Bedrock AgentCore observability therefore fits best when AgentCore is the runtime and CloudWatch is already the operational control plane.
Adjacent options address different layers. Framework-native tracing is useful during development because it preserves application and workflow context, but it should not become the only incident record. A vendor-neutral distributed-tracing pipeline fits mixed-runtime or cross-cloud estates that need one query surface. Explicit workflow orchestration suits deterministic handoffs, retries, and approval gates; autonomous decision loops still need end-to-end traces because the failure may be a wrong tool choice rather than a failed task. Runtime controls such as timeouts, retry ceilings, tool allowlists, and human-review gates constrain behavior; telemetry shows whether those controls worked.
Van Data Team recommends a layered approach: preserve AgentCore’s per-agent log boundary, correlate it with fleet-wide traces, and retain framework context where it adds diagnostic value. Before production validation, enable CloudWatch Transaction Search once. AWS says searchable spans can take about ten minutes to appear, so include that delay in rollout checks.
Conclusion: Make Observability Part of the Runtime Contract
A verified Amazon Bedrock AgentCore configuration with dedicated per-agent CloudWatch log groups can give each agent a cleaner operational boundary. Distributed traces can then help teams reconstruct decision points, tool calls, repeated actions, and workflow transitions through CloudWatch.
The setup is not fully automatic. Transaction Search must be enabled before spans become searchable, and deployment verification should account for the indexing period.
From there, the work belongs to the operating team: map agents to owners, verify logs and traces separately, define workflow-level SLOs, alert on failures that require action, preserve trace identifiers, and design retry, fallback, and human review paths.
The practical goal is not more telemetry. It is enough trustworthy evidence to explain a bad run, contain its impact, recover safely, and prevent the same failure from returning.

Founder of Van Data Team. Builds Vanaxity, the AI agent system for SEO, GEO, and AEO, and leads data engineering delivery for B2B teams.
About the authorArticle FAQ
Questions readers usually ask next.
These short answers clarify the practical follow-up questions that often come after the main article.
Need a similar system?
If this article maps to a workflow your team already operates, the next step is usually a scoped review of the system, constraints, and rollout path.
Consultation
Scope your next AI workflow.
Share the system and blockers. We will map fit, gaps, and the next step.